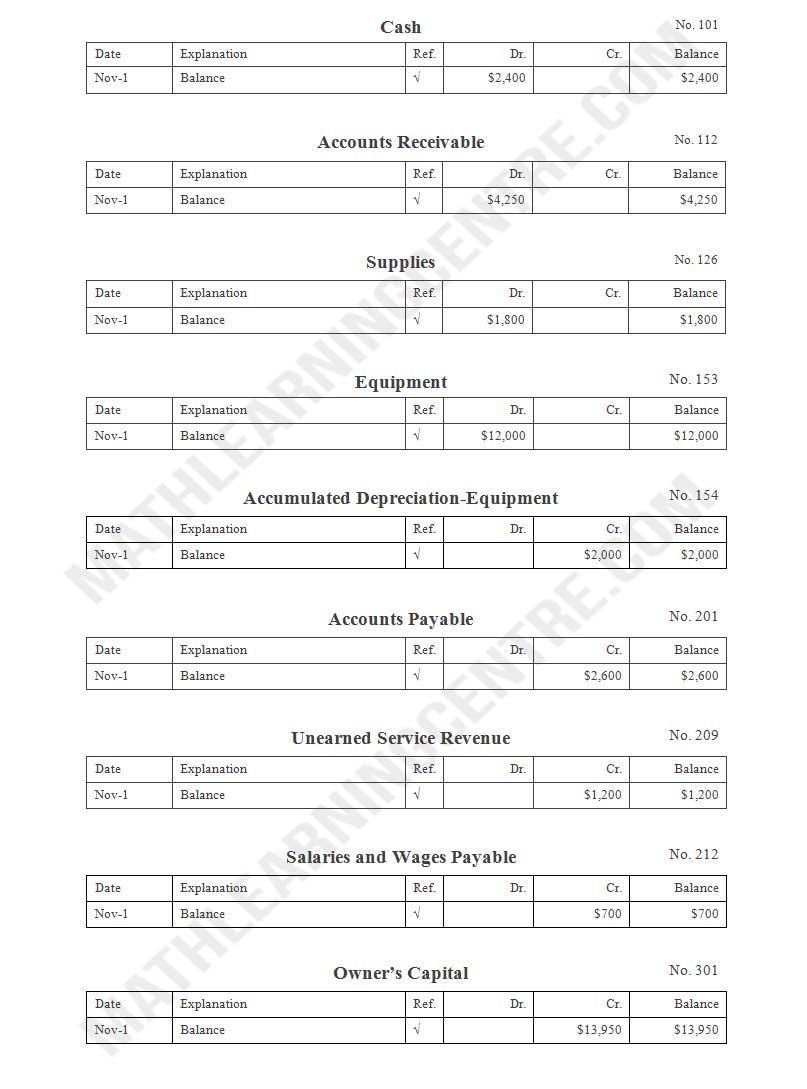
On November 1, 2017, the account balances of Hamm Equipment Repair were as follows:

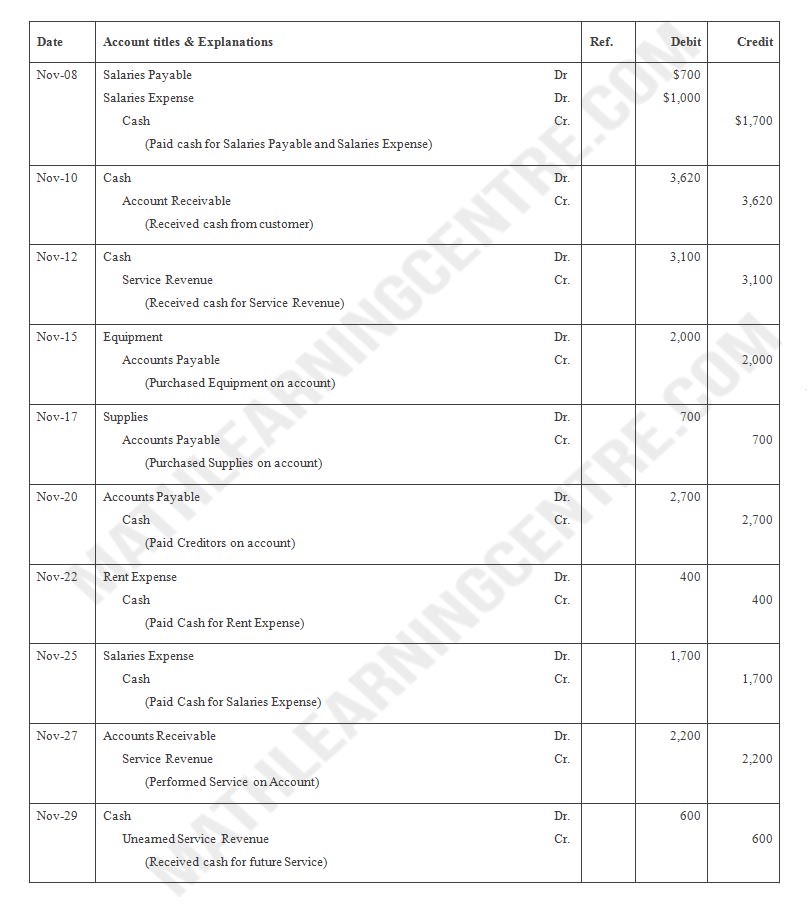
During November, the following summary transactions were completed.
Nov. 8 Paid $1,700 for salaries due employees, of which $700 is for October salaries.
10 Received $3,620 cash from customers on account.
12 Received $3,100 cash for services performed in November.
15 Purchased equipment on account $2,000.
17 Purchased supplies on account $700.
20 Paid creditors on account $2,700.
22 Paid November rent $400.
25 Paid salaries $1,700.
27 Performed services on account and billed customers for these services $2,200.
29 Received $600 from customers for future service.
Adjustment data consist of:
1. Supplies on hand $1,400.
2. Accrued salaries payable $350.
3. Depreciation for the month is $200.
4. Services related to unearned service revenue of $1,220 were performed.
Instructions:
(a) Enter the November 1 balances in the ledger accounts.
(b) Journalize the November transactions.
(c) Post to the ledger accounts.
(d) Prepare a trial balance at November 30.
(e) Journalize and post adjusting entries.
(f) Prepare an adjusted trial balance.
(g) Prepare an income statement and an owner’s equity statement for November and a balance sheet at November 30.
Thanks